Do you see anything?
· Indicators
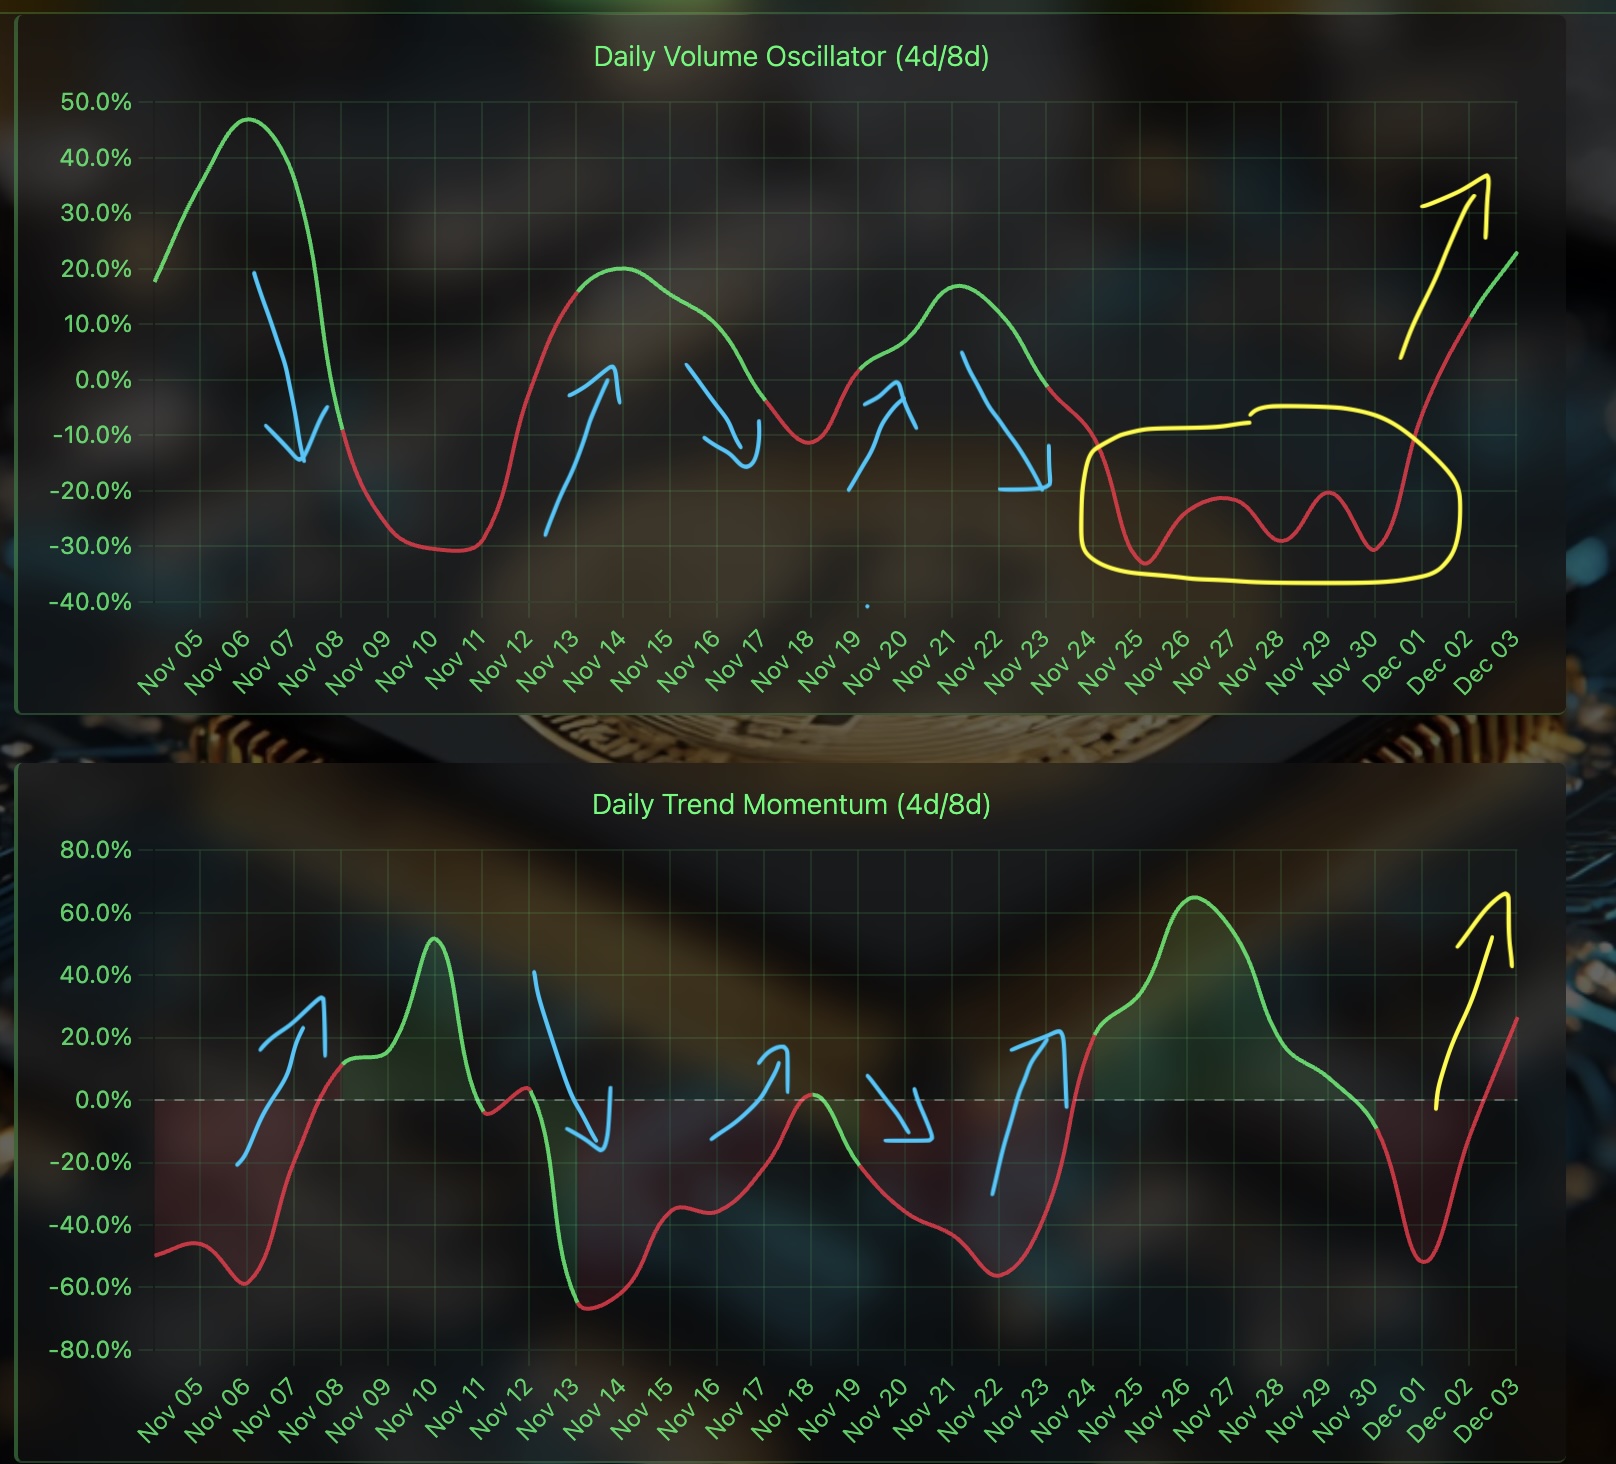
When analyzing Bitcoin momentum, we use two complementary indicators working in tandem: Volume Oscillator (VO) and TMOM (Trend Momentum). But do you see the patterns they create together?
Understanding the Two Forces
Volume Oscillator (VO) measures the momentum of trading activity by comparing short-term vs long-term volume averages. It answers: "Is buying/selling pressure accelerating or decelerating?"
TMOM (Trend Momentum) measures price Rate of Change (ROC) acceleration between short and long periods, enhanced by volume confirmation. It answers: "Is price movement gaining or losing strength?"
Why Two Momentum Indicators?
The magic happens when you compare them:
- Volume leads price — VO often moves first, showing accumulation/distribution before TMOM reflects price reaction
- Confirmation vs divergence — When both align (both positive or both negative), the signal is stronger. When they diverge, caution is warranted
- Strength measurement — Large VO + large TMOM = high conviction move. Small VO + large TMOM = weak volume support (unsustainable)
Reading the Signals
Strong Bullish (Both Positive)
VO > 0 AND TMOM > 0: Rising volume + rising price momentum = healthy uptrend. Ideal condition for trend-following entries.
Strong Bearish (Both Negative)
VO < 0 AND TMOM < 0: Declining volume + falling price momentum = weakness. Consider exit or short positioning.
Bullish Divergence (VO positive, TMOM negative)
Volume is picking up, but price hasn't responded yet. Potential early accumulation phase — watch for TMOM to turn positive as confirmation.
Bearish Divergence (VO negative, TMOM positive)
Price still rising but volume is declining. Warning sign of exhaustion — momentum may fade. Tighten stops on long positions.
Practical Application in Analysis View
Use the three timeframes to build conviction:
- Weekly alignment — Check if VO and TMOM agree on weekly charts. This sets the primary trend context
- Daily timing — Look for daily VO/TMOM alignment within the weekly trend for entry timing
- Hourly confirmation — Use hourly divergences for stop-loss adjustments and short-term exits
TMOM Value vs TMOM Strength
The Analysis View shows two separate TMOM metrics per timeframe. They answer different questions:
- TMOM Value (e.g. 1.53% UP) — Direction + speed. Signed −90 to +90%. Sign = direction, magnitude = how fast price is moving relative to the reference period.
- TMOM Strength (e.g. 45.90%) — Relative magnitude. Always 0–100%, no sign. Measures how large the move is compared to the recent price range (volatility-normalized).
They can diverge significantly. Example: TMOM Value = 1.53% (small absolute ROC) + TMOM Strength = 45.90% (large relative to a very narrow recent range). This means the move is small in absolute terms but dominates the current tight range — a high-conviction micro-move.
Practical rule: TMOM UP + high Strength (≥30%) = strong directional move worth trading. TMOM UP + low Strength (<5%) = weak drift, wait for confirmation.
Current Parameters
Volume Oscillator:
  Weekly: 4 / 8 weeks
  Daily: 4 / 8 days
  Hourly: 4 / 8 hours

TMOM (Trend Momentum):
  Weekly: 4 / 8 weeks
  Daily: 4 / 8 days
  Hourly: 4 / 8 hours

Both use 4/8 period comparison for consistency.
Adjustable in Settings view.
Key Insight
Look for alignment across indicators AND timeframes. A weekly VO+TMOM bullish signal, confirmed by daily alignment, with hourly showing early momentum = high-probability setup. Conversely, conflicting signals across timeframes = choppy conditions, reduce position size.
Visual Pattern Recognition
Train your eye to spot these patterns quickly:
- Both green (positive) = Go signal
- Both pink (negative) = Caution/Short signal
- Mixed colors = Wait for alignment or use as divergence warning
- Magnitude matters = Large values (near ±100) show stronger conviction than small values (near 0)
Limitations & Context
These are momentum oscillators, not standalone trading signals:
- Range-bound markets — Both oscillate without clear trend, reducing reliability
- Low liquidity periods — Volume spikes can create false VO signals (weekends, holidays)
- Event shocks — Sudden news can override technical momentum (use as filter, not trigger)
Next Steps
Combine VO/TMOM analysis with other system components: Pivot levels for structure, Trend indicators for context, Volatility measures for risk sizing. The full picture emerges when all layers align.