The Economics of a Single Slot: What 200 Backtests Taught Us — and Why Position Size Beats Another Indicator
· Strategy

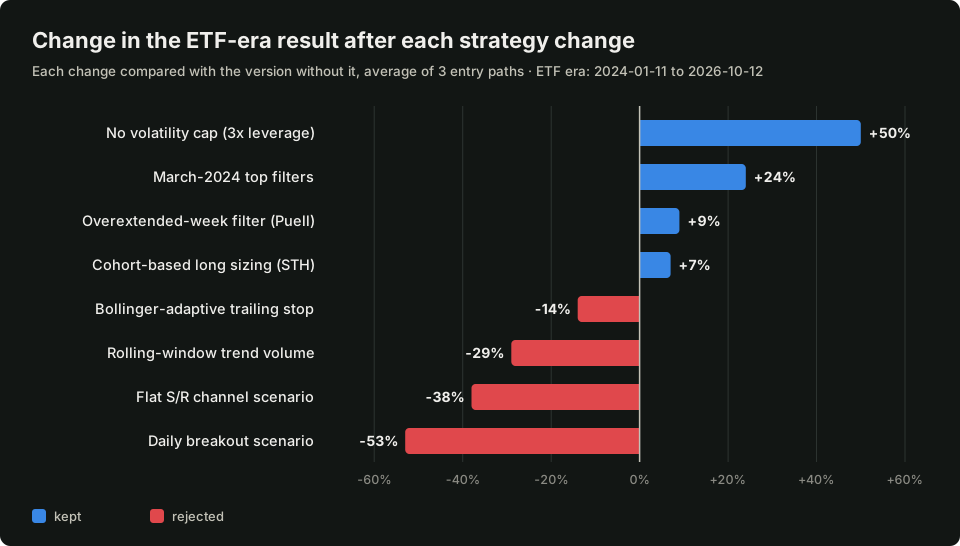
Over the past weeks we ran our BTC strategy through more than 200 backtests. We tried faster and slower trends, new technical scenarios, an adaptive trailing stop, on-chain filters and cohort analysis. Of eight major ideas, four survived — and all of them are about how much to buy or when not to buy, not about adding another entry signal.
This article explains how we test, what failed, what worked — and one rule that accounts for almost all of these results.
1. How we test: three paths, two eras, one codebase
A single backtest can lie. Shift the entry timing by 10 minutes and the result of recent years can move by tens of percent — one position exits earlier, the next one enters somewhere else, and the effect cascades. So every change is judged three ways:
- Three entry paths — the base run plus two runs in which new positions may open only on every other 10-minute step (with a phase shift). A change is real only if it helps on all three.
- Two eras — 2018–2023 and the ETF era (from 2024-01-11). A market driven by fund inflows behaves differently from earlier cycles, and the ETF era is our main yardstick.
- The same code as production — backtest indicators are computed by the trader's own code and stamped with its version. If the data was computed by a different version, the backtest refuses to run.
"Offline" analyses (e.g. recomputing what would happen if certain trades were removed) are only a sieve. Several times they pointed in a direction the backtest later rejected.
2. The economics of a single slot
The strategy holds one position at a time. That has a consequence that is easy to forget: every new scenario competes for the same slot with the existing ones.
Example: a scenario buying breakouts from a flat S/R channel was profitable on its own — run alone, it grew capital 1.5–2x in the ETF era. Added to the strategy, it cut the result by 38%. It tended to enter just before a better signal would have fired, and the slot was already taken. Likewise, a breakdown short blocked the dip-buying scenario — the latter fell from +170 to +56 points of summed ROI.
A new signal has to be more than profitable. It has to be better than what it displaces.
3. The "flaw" that is a feature
The volume that confirms our daily uptrend is measured on the current day — which early in the morning holds only a fraction of the day's turnover. So just after midnight the trend shows LONG less often than in the evening. That looked like a bug, so we "fixed" it by measuring volume over rolling 24-hour windows. The result: −29% in the ETF era.
It turned out that this morning block was filtering out losing entries: right after midnight UTC a new day of on-chain data arrives, and some scenarios wanted to buy then on fading turnover. The broader lesson: don't fix an indicator whose "flaw" your strategy is already exploiting.
4. Oscillators in a flat channel: the opposite of the textbook
The classic advice says: in a sideways market, trade the oscillator — buy oversold, sell overbought. We tested it on 8 years of data, defining "sideways" two ways (Kaufman's efficiency ratio and the slope of weekly S/R lines). Under neither definition did fading CCI or Bollinger Band extremes have an edge.
The opposite result was more interesting: when the weekly S/R channel is flat, an extreme CCI reading or a close outside the Bollinger Band more often marks the start of a breakout than a reversal. Buying a daily CCI > 100 inside a flat channel returned +1.3% over 3 days on average (pre-ETF) and +0.75% (ETF era), against +0.3% for simply holding. A compressed market doesn't turn back — it springs.
5. What worked: size, not another signal
The volatility cap at 3x leverage
Cutting positions during high-volatility periods reduced drawdowns in 2018–2021, but in the ETF era it cost a lot of profit. With funding costs included, removing the cap added +50% on average in the ETF era, with the drawdown in that era almost unchanged.
Cohort analysis: who is buying BTC right now?
From the supply distribution by coin age we compute the supply held by short-term holders (STH, coins younger than 6 months). When that supply grows over 30 days, coins are changing hands — new demand is entering the market. Longs opened in those conditions earned clearly more per trade than the rest — about 2.3x before the ETF era and about 1.5x within it.
Since both groups of trades were profitable, a filter could only hurt. Instead we change the position size: ×1.15 when STH supply is rising, ×0.87 when it is falling.
The exposure-neutral test
Here lies an easy trap: with leverage and compounding, any increase in average position size improves a backtest. The first variant (×1.2 / ×0.85) added +10%, but it enlarged longs by 1.5% on average — which alone is worth about +8%. Only the variant tuned so that the average size didn't grow (it even shrank slightly) showed the signal's true value: +6–8% in the ETF era on all three paths, at the cost of a drawdown about 2 points higher.
If a sizing change improves the result, check whether the signal improved it — or just more leverage.
6. March 2024: a zero-sum game
The worst stretch of the ETF era is the rally to the record high in March 2024. On-chain indicators showed "overheating", so the cycle-top short scenario opened positions — and lost, because ETF funds kept buying. We blocked it during abnormally strong fund accumulation… and the trend scenario took the same slot, buying right at the top.
A single filter did nothing, because the slot just passed from one loss to another. Only two filters together — no shorts during strong fund inflows, and no buying far above the weekly Bollinger Band — added +24%.
7. An overextended week without euphoria
The strategy's worst single losses (down to −20% of the balance) came from a scenario that buys when miners earn above average and the daily trend is up. We searched for the cause across dozens of indicators at once. The common denominator of the losing entries: the week already strongly extended, while sentiment is not yet euphoric (high weekly momentum with Fear & Greed below ~74).
Blocking those entries added +8–9% in the ETF era and cut the maximum drawdown over the whole period from about 62% to 56%. By comparison, simply shrinking positions in that scenario lowered the drawdown but cut profit on every path. It is better not to enter bad trades than to enter them smaller.
8. Rules that stay
- Judge a change on several paths and in several eras — one backtest is an anecdote.
- Count the slot's opportunity cost — a new signal displaces an old one.
- Don't fix "flaws" you profit from — first check who relies on them.
- Position size is the strongest lever — but test it at the same average exposure.
- Slow market states (cohorts, on-chain, the week) filter better than fast ones — hourly signals shift an entry by minutes without changing its outcome.
Caveats
All figures come from backtests on historical data and include fees and funding costs. Many variants were tested on the same data, so part of any edge is likely fitted to history — which is why we only act on changes that are consistent across all paths and have a clear cause. The real yardstick will be comparing live trading with the backtest over the same days, which we track continuously. Past results do not guarantee future ones.